How to debug
Debugging an STM32 Arduino sketch requires a debug probe, a firmware image with debug symbols, and a debugger configuration that matches the target MCU. The Arduino IDE 2 workflow is the recommended and officially supported option; the other sections describe community or tool-specific alternatives.
Before starting, verify that:
- The board is powered and the debug probe is connected to the SWD pins. ST-LINK/V2 and ST-LINK/V3 are supported by the recommended workflow.
- The selected board and upload/debug interface are supported by the tool being used.
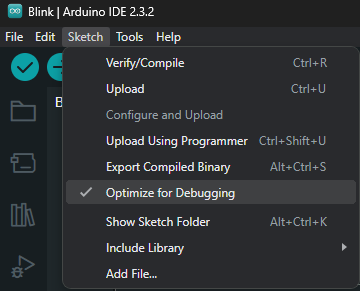
- The sketch is compiled with debug information. In Arduino IDE 2, select Optimize for debugging; in other tools, use the equivalent
-gorDebugbuild option. - You know where the generated ELF file is located. GDB needs the ELF file to resolve symbols, even when the board was programmed with a BIN or HEX file.
Warning
Only the Arduino IDE 2 is officially supported.
Arduino IDE 2 (Supported and recommended way)
Note
Requires a ST-Link/V2 or ST-Link/V3 device connected to the PC over USB and to the board via the SWD interface.
-
If not already done, Getting Started
-
Configure the IDE to the desired board. Here the Nucleo L476RG which already includes a ST-Link.
See Getting Started
-
Open the Blink sketch from the "File> Examples > 01.Basics > Blink".
-
Select the "Optimize for debugging" in the "Sketch" menu:
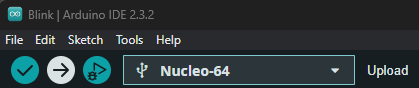
- Click the upload button
See Getting Started to change the upload method.
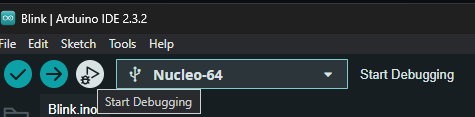
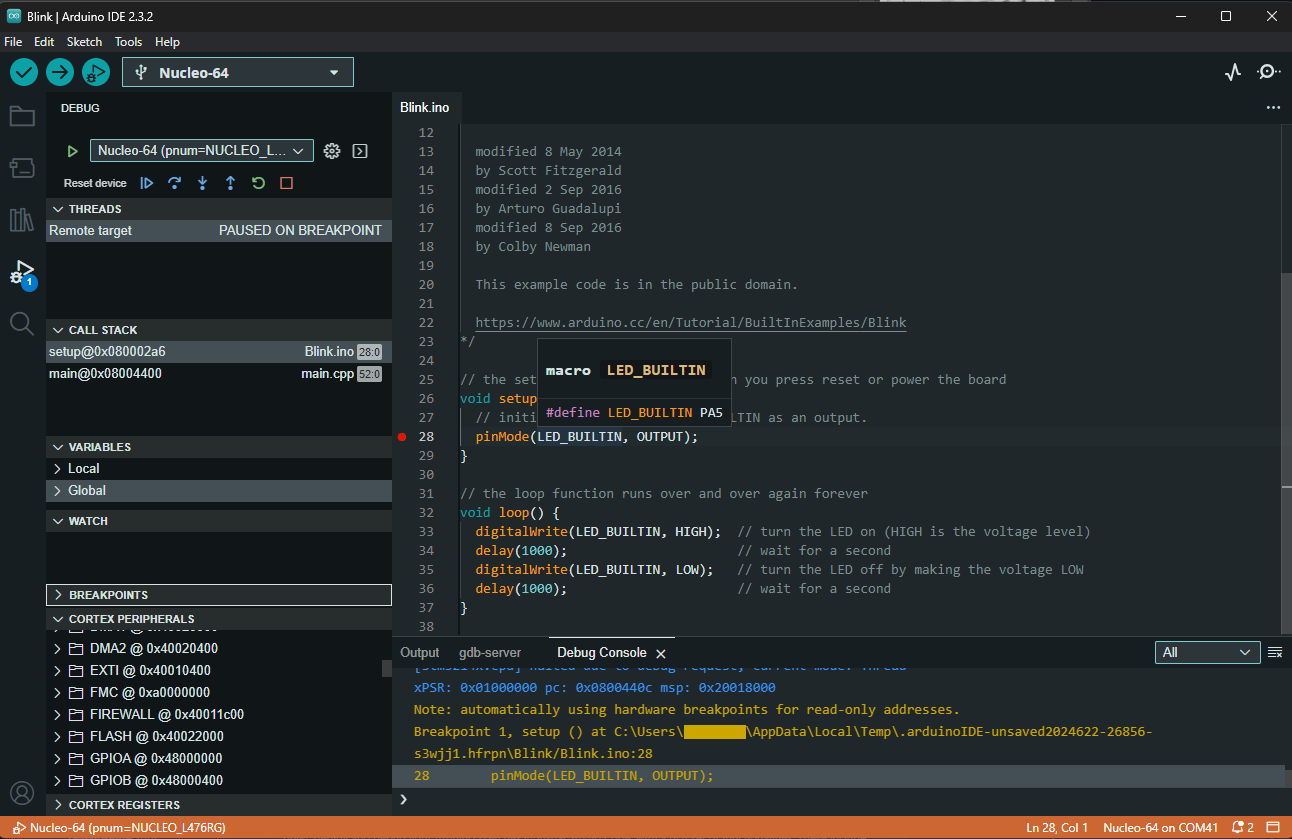
- Click the start debugging button:
Tip
Refer to official documentation to see how Using the Debugger.